
If you have to scan a network, that might potentially have many running hosts, you will probably use Nmap. And if your weapon of choice is Nmap, you will soon realize that working with the results is a pain in the ass when there is a lot of data. No matter in what format from the supported ones (normal, XML, s|<rIpt kIddi3, or Grepable) you saved the Nmap scan results, it will be hard to analyze them. And this is where comes the WebMap that helps by providing a dashboard for Nmap XML scan results.
What is the WebMap?

Official WebMap repository on GitHub.
WebMap is a tool for visualizing Nmap scan results. It works in a very simple way – it parses the scans you made with Nmap and loads everything into a good-looking dashboard. The dashboard has all the details received during the original scan, but additionally, it provides a visual view of open ports, detected services, etc.
WebMap has many cool features:
- PDF reports generation – useful when you want to save results for the future. You might then compare if there are any changes.
- Importing and parsing Nmap XML files – this is basically what the WebMap is all about.
- Running and scheduling Nmap scans from the dashboard – another cool feature that will be useful if you want to rescan the same targets and to compare if there are any changes.
- Statistics – visualization of different aspecs of the scan, such as open, closed, or filtered ports, services, OS, etc.
- Labels or notes for the hosts – very handy feature when dealing with a large amount of hosts.
- Copy to clipboard, as Nikto, Curl, or Telnet commands – if you are dealing with a basic Nmap scan results, and hadn’t used any scripts or service detection, you will find this feature handy. WebMap will create a Nikto command for you, and all you will need to do, is to execute it.
- RESTful API – by using the API you are be able to query scan files.
- Checking for CVEs and exploits – when a specific version was detected, WebMap can check for CVE of the service.
WebMap comes in handy when you want to see data of several Nmap XML reports on the same dashboard.
How to use the WebMap for Nmap XML results analysis?
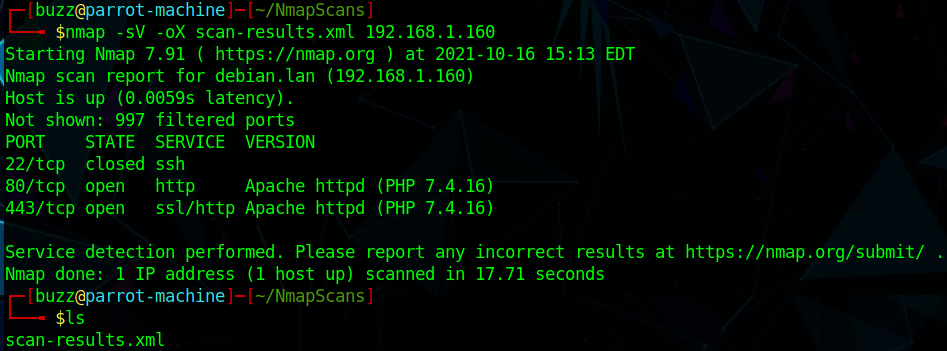
First of all, we will need to have at least one XML Nmap report in order to feed this data to WebMap.
nmap -sC -sV -oX scan-results.xml HOST_IPUsing the -oX option will write results into an XML file. This file later will be used to parse data to the dashboard. But don’t worry about the technical details, WebMap will take care of it.
As we already have the scan results saved in XML, we can move forward with the WebMap installation.
The suggested way is to use the Docker image. Alternatively, you might run it without docker – as a custom Django installation. For this purpose, you can find the instructions in Dockerfile. But using Docker container is a way to go.
Firstly, make a directory for WebMap. We will put our XML files in it. The directory will be passed to the container as a volume, and then, the Nmap XML reports will be displayed on the WebMap dashboard.
mkdir /tmp/webmapThen you can use the following Docker command to set a name for the container, specify port, pass the previously created directories path to the container, pull the needed reborntc/webmap, and lastly run everything:
docker run -d --name webmap -h webmap -p 8000:8000 -v /tmp/webmap:/opt/xml reborntc/webmapIf everything went smoothly, you should be able to see the default WebMap page on localhost:8080.
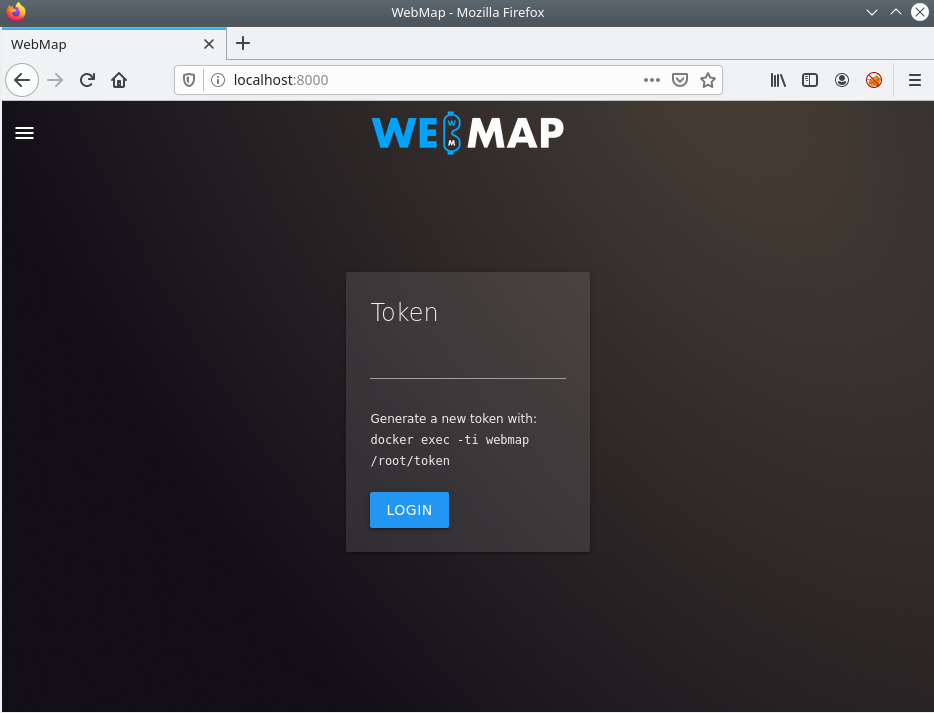
The next step would be to generate a token. Without the token, you won’t be able to access the dashboard.
docker exec -ti webmap /root/tokenThis command generates a token inside the running container.
After you’ve generated the WebMap token, enter it into the webpage. A dashboard should be displayed to you.
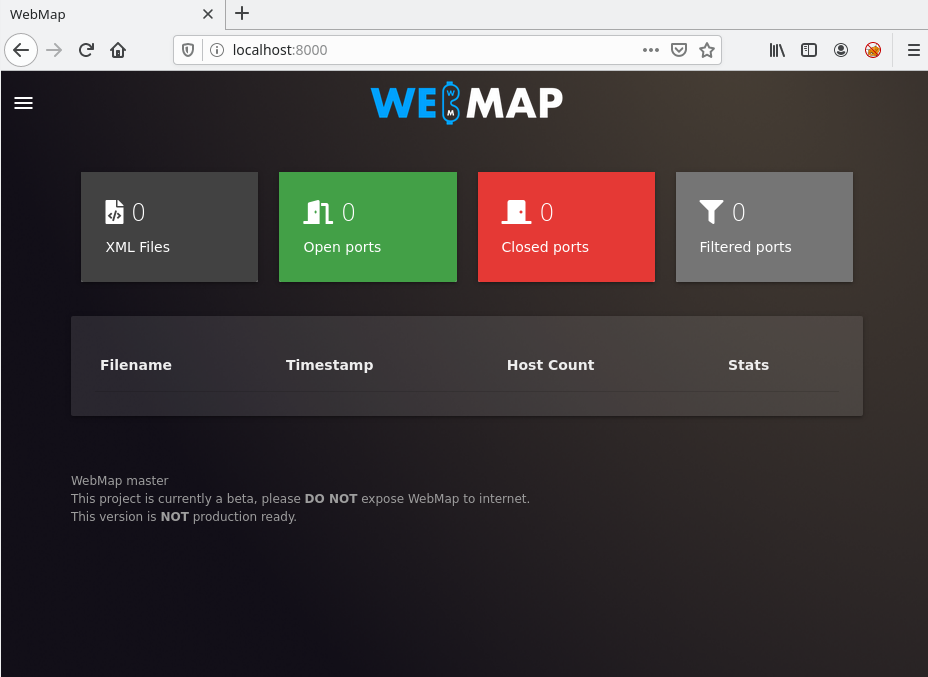
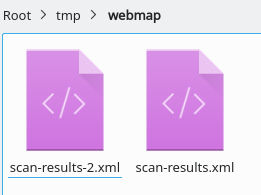
However, it does not have any data yet. Copy the Nmap XML reports to /tmp/webmap directory. For the sake of this tutorial, I will use two different XML reports.
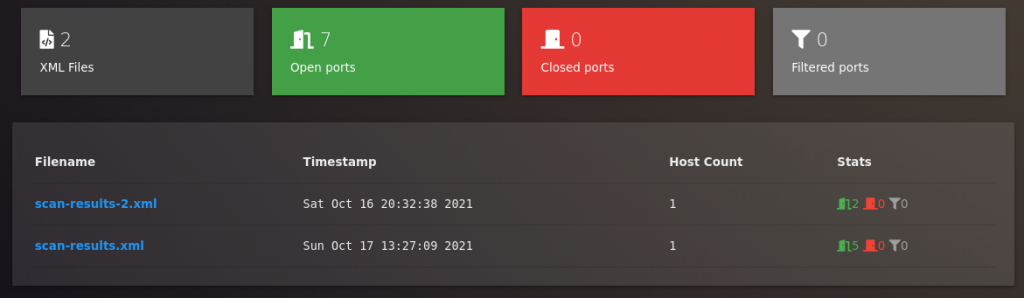
If you did everything correctly, you should see the same XML reports of Nmap scans that you put into the folder. On the home page of the WebMap, you should see general information – how many open, closed, and filtered ports there are on the scanned hosts, and from how many XML files the data was taken from.
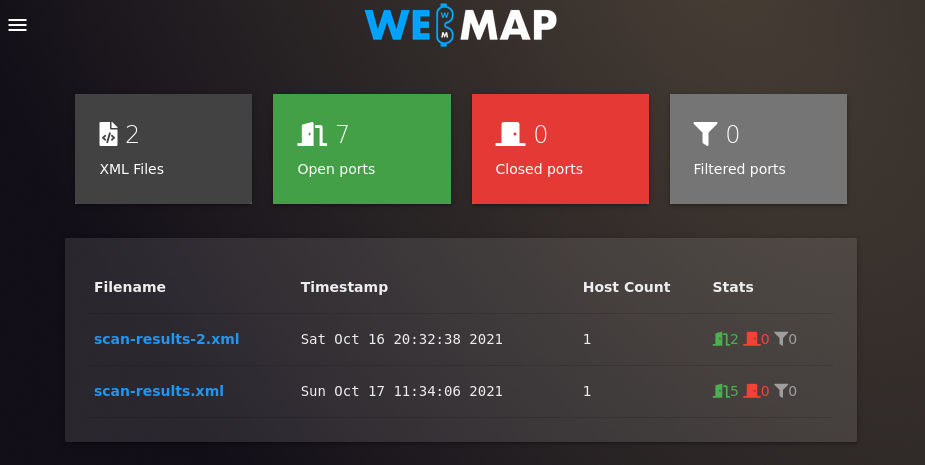
By clicking on a specific XML file, you will get all the details.
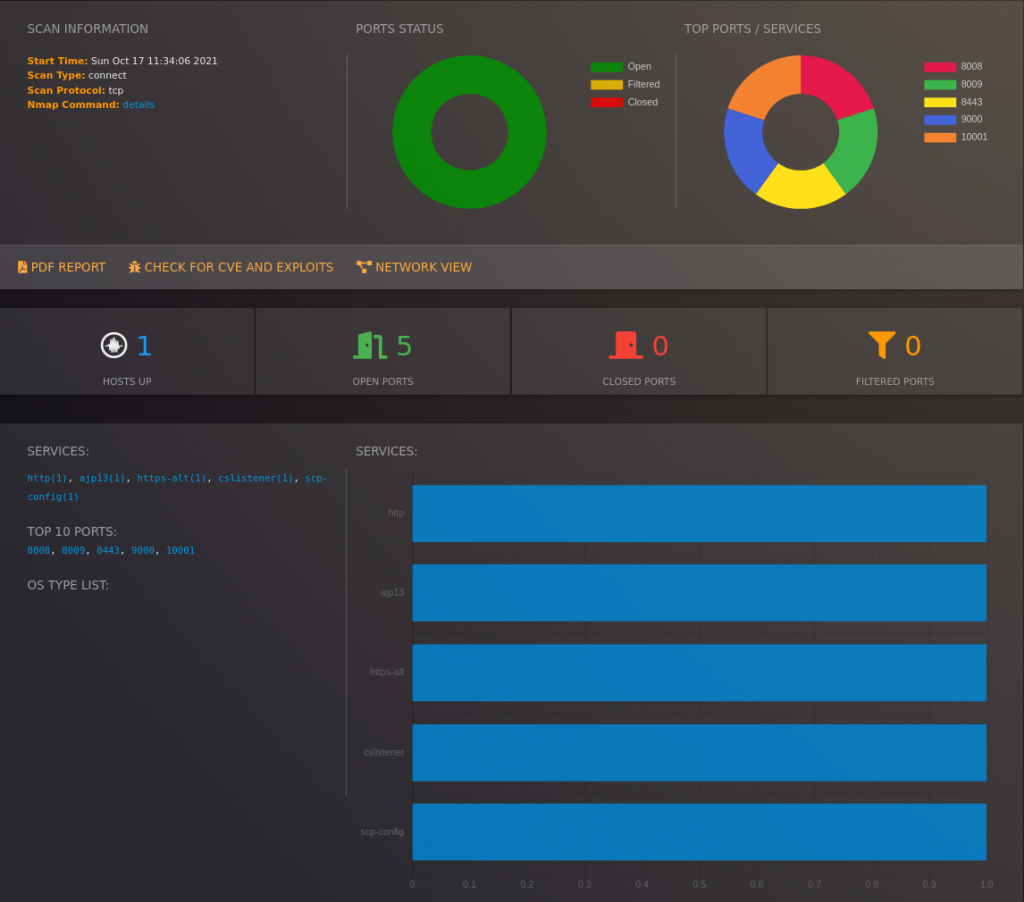
WebMap helps to visualize different things:
- Top ports and services.
- Number of open, filtered, and closed ports.
While this does not seems to be that useful while only one host was scanned, but when the Nmap XML report has data of tens or hundreds of targets, all these features become handy.
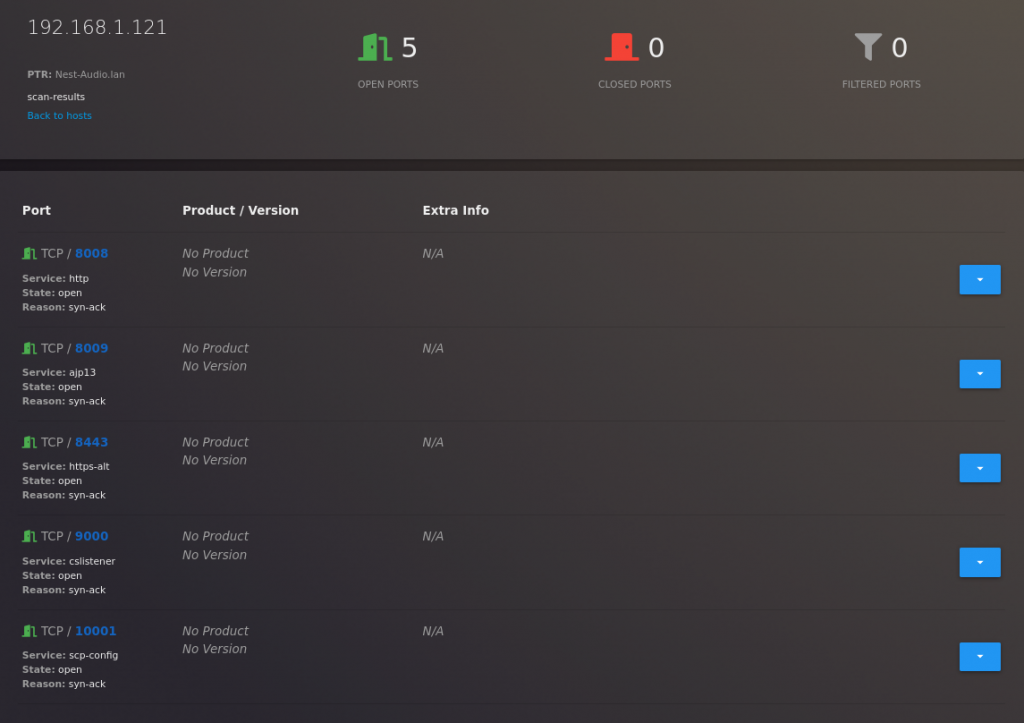
While the aggregated statistic is helpful, it is also often needed to see specific details of different targets. By scrolling down to the end of the dashboard, you will be able to check details of different targets
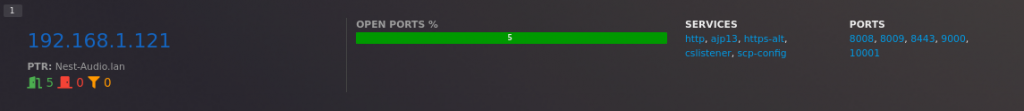
And by clicking on the IP address, you will be able to get even more details (such as detected services’ versions).
If you do want to view details from another XML report, you can do so by opening it from a home page.
Another cool feature of the tool is the PDF generation. While the WebMap dashboard is great for analyzing Nmap XML scan results, the results are on the dashboard only. If you do want to save them for the future, the best approach would be to generate PDF. All the information that there was on the dashboard, will be transferred into the document.
This is how the PDF report of another XML file used in this tutorial, looks like.
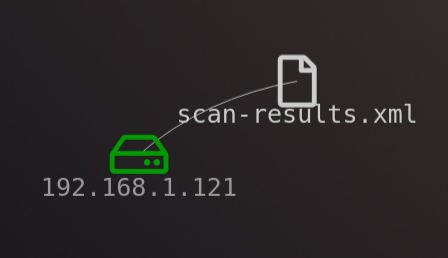
You can also use Network view functionality to visualize the hosts.
2 tips for working with the WebMap
Lastly, I have a few tips from my personal experience of using the WebMap:
- Do not expose this to the internet. It might lead to stored XSS and information leakage. This application is created for local use only. This was stated by the official creators on the product’s GitHub repository.
- If you need to scan a number of targets, it is a better idea to save everything into one Nmap XML file. The reason for this, is that with several Nmap XML reports in dashboard, there will no overall statistics. I will use screenshots to iliustrate what I mean:
In case you do have two XML reports loaded, you will see how many ports there are overall on both of them.
But if you want to see these diagrams:
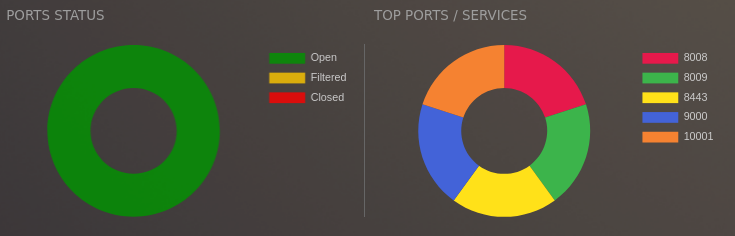
You will have to open a specific report. And you will see the data of only that report. If you want to have this visualization for all of the XML files, you should have it in one XML file. If you do have different XML files and you want to make one ultimate Nmap report, you can use this tool.
That’s it, hope this was helpful for you!

Highly passionate about cyber security (penetration testing, bug bounty hunting, cybersecurity in general), and blogging. I am experienced in vulnerability assessments, penetration testing, various security audits, had worked with various clients, most of them were in finance sector.
CompTIA Security+, CEH, CEH Practical, CEH Master, and OSCP certified.